The Channel View certainly provides a quick look at your data, but is not the most convenient or flexible way to display your data, especially once you have more than one channel. In this section we'll add a component some different components to a page that will display data from the pressure channel.
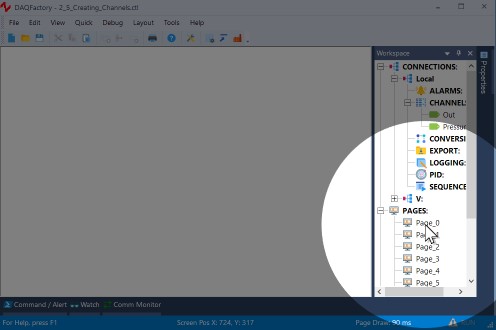
1. Click on Page_0 in the workspace under PAGES.
This will display a blank white page. When DAQFactory starts, 10 blank pages are generated automatically with default names. You are not limited to these 10 pages and can create as many pages as you want.*
Note, unlike other versions of DAQFactory, Express has a limit of 2 pages available.
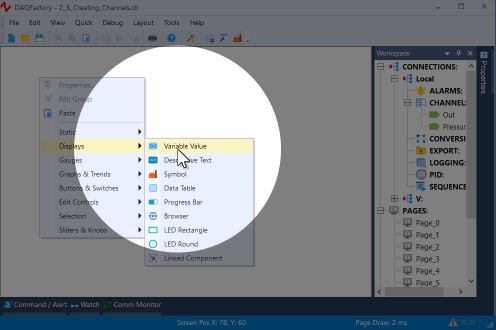
2. Right-click somewhere in the middle of the blank area and select Displays-Variable Value.
This will place a new page component on the screen. There are many different components available that allow you to create custom screens. This particular component simply displays a changing value in text form.
Note: You must hold down the Ctrl key to select and move screen controls. If you do not hold the Ctrl key, DAQFactory will assume you want to interact with the control (i.e. press a button, drag a slider, etc...).
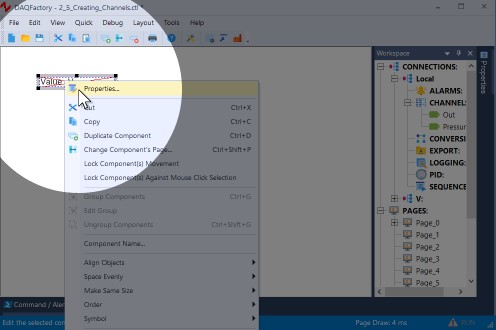
3. Right click on the new component and select Properties.... If the component is not selected you may need to Ctrl-Click on the component to select it again.
All of the screen components have different properties windows for configuring the look of the component and telling the component what data to display.
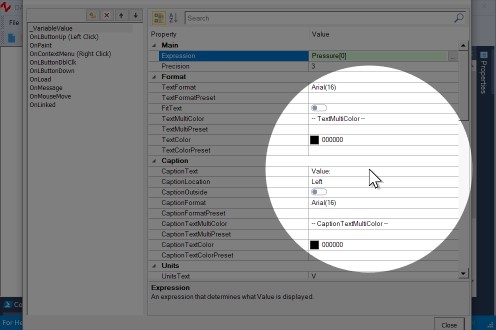
4. Next to Expression:, enter Pressure[0].
Expressions are actually formulas that you can enter to display calculated data. In this case, the formula simply requests the most recent data point of the channel pressure. The [0] indicates the most recent data point. If you did [1] you'd get the next most recent data point and so forth back to the History length of the channel, which we left in the default of 3600. You could just as easily put Pressure[0] * 10 if you wanted to display the channel's value times ten.
Note: A common error is to use () instead of [] for subsetting. Although this works in some cases, it does not work in all, nor do we guarantee that it will continue to work in newer versions.
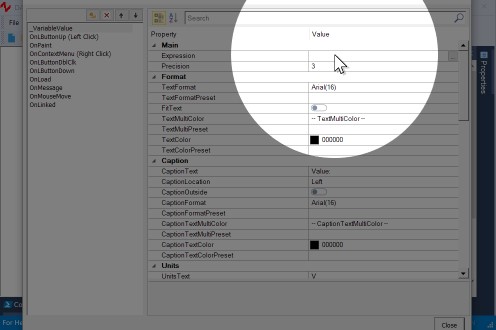
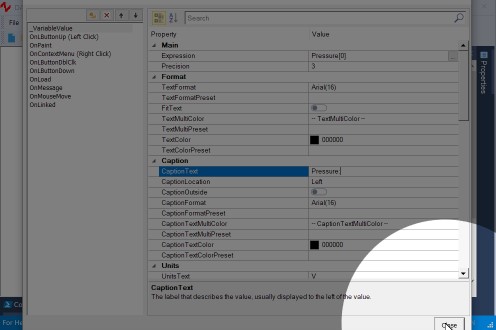
5. Next to CaptionText, enter Pressure:.
The caption is what is displayed in front of your value.
6. Click on Close.
Now the screen should display Pressure: 0.324 V with a changing number. This is the current value in the pressure channel we created earlier. Feel free to open the properties window again and play with the units, text format and other settings.
7. Ctrl-Click on the Variable Value component.
This will select the component, as indicated by the shaded rectangle surrounding it. Remember: you must hold down the Ctrl key while clicking to select the component.
8. Ctrl-Click and drag the Variable Value component to a new location on the screen.
This allows you to move the component around the screen. Again, you must hold down the Ctrl key to move a component around. You can also nudge the component using the arrow keys on the keyboard. Hold down Shift while pressing the arrows to nudge a little faster.
The next steps will not work in DAQFactory Express because that version doesn't include gauges. Consider upgrading to any of the paid versions of DAQFactory to get gauges and a lot more!
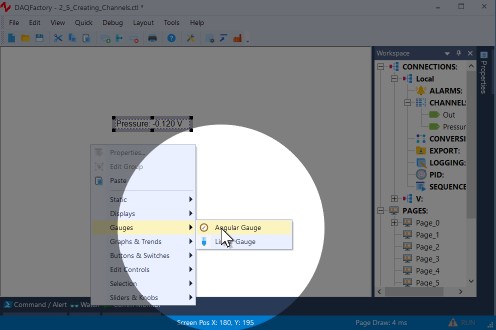
9. Right click somewhere else on the screen away from the displayed component and select Gauges-Angular Gauge.
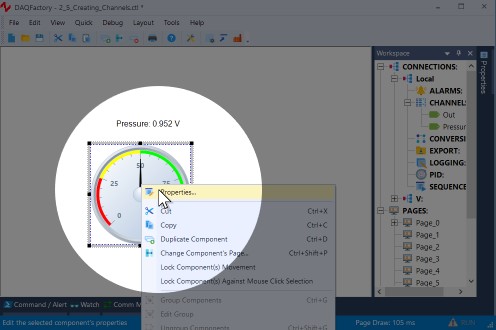
10. Right click on the new component and select Properties... to open its properties window.
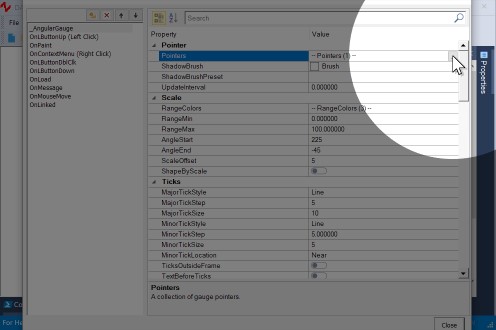
11. Click on Pointers under Pointer, then click on the box on the right side with three dots  . If the button is not visible, just click anywhere in the row labelled Pointers and it will appear.
Gauges support multiple pointers, which are edited in a separate window for the Pointers property. There are a number of properties that have separate windows for changing their properties. These are indicated by the box with three dots, , on the right side of the given property.
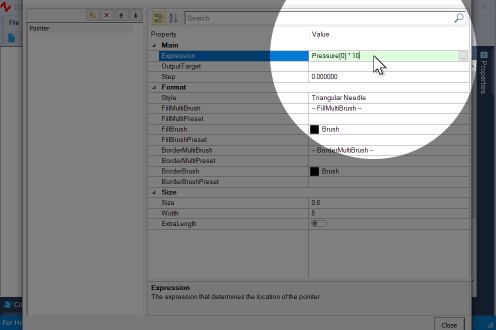
12. For the Expression for the existing pointer, replace the 50 with Pressure[0] * 10, then click Close.
As we mentioned before, expressions are actually formula so wherever there is an expression we enter in calculations. This particular one simply takes the most recent value of the pressure channel and multiplies it by 10.
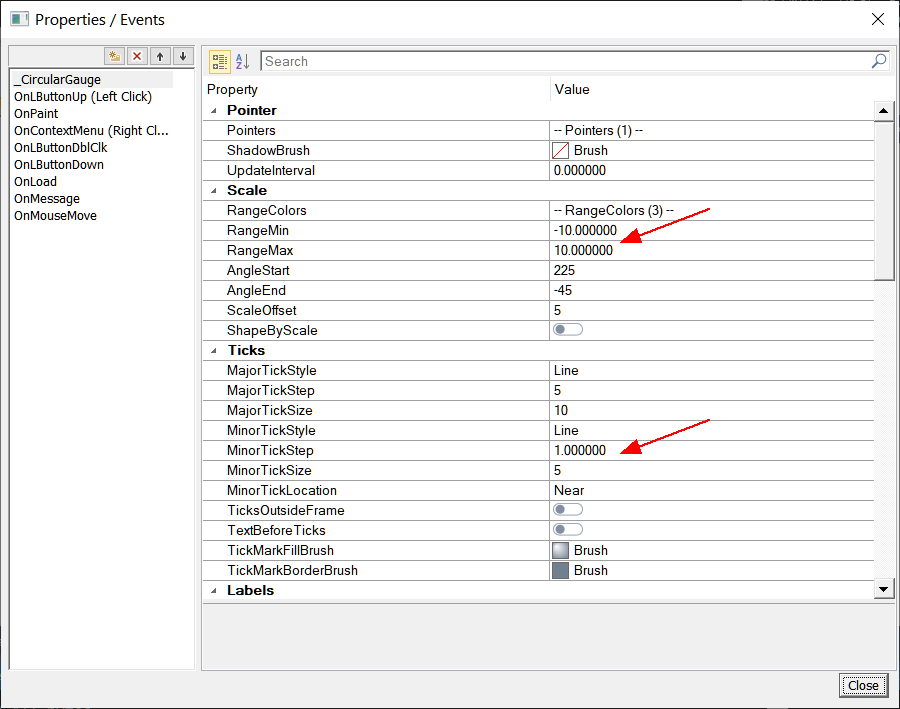
13. Back at the main properties window, for the RangeMin, enter -10, and for RangeMax, enter 10. Then farther down under Ticks, change the MinorTickStep to 1 so that we get ticks every 1 unit instead of every 5.
Since pressure is simply a sine wave of amplitude one, and we're multiplying this by 10, the range this component will see is -10 to +10.
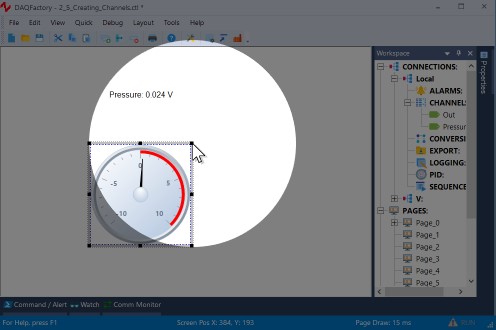
14. Click Close.
The gauge will now be scaled from -10 to 10 and the gauge arrow will move with the value of pressure. Notice how the first screen component still displays values from -1 to 1. Both of these components are independent of each other.
15. Ctrl-Click on the first Variable Value component.
This will select the component, as indicated by the shaded rectangle surrounding it.
16. Ctrl-Click and drag the Variable Value component to a new location on the screen.
This allows you to move the component around the screen. Try the same thing with the gauge.
17. Ctrl-Click on the gauge. Square dots will appear at the corners of the gauge. Click and drag these dots to resize the graph.
The gauge is a resizable component and displays square black dots around the selection rectangle for resizing.
You now know how to display your data using several different screen components. Next we will learn how to use the graph to display historical data.
In the mean time, feel free to play with other similar components if you'd like. When done, you can delete them by selecting the component and then right clicking and selecting Delete Component.
For more information on page components and creating your user interface, see the chapter entitled Pages and Components.
For more information on expressions and the functions available for use in expressions, see the chapter entitled Expressions.